

As investors, you may be struggling with technical analysis, believing it is hardcore finance stuff. But believe us, technical analysis is not as technical as you think. Have you heard the proverbial saying “History repeats itself”? This simple premise is the starting point of technical analysis. In technical analysis, you analyze past price patterns and predict whether the past will repeat or not. Charts are the most commonly used tool for analyzing these patterns. Today, we will walk you through one of the most important charts used in stock market analysis: the Candlestick chart. We will look at what the candlestick pattern is.
What is a Candlestick Pattern?
Candlestick charts serve as a technical instrument consolidating data from various time frames into individual price bars. The visual representation of price movements in the financial market, typically displayed in a candlestick chart, is known as the Candlestick pattern.
Want free trading calls from SEBI-registered experts?
Join the Gap Up Telegram Channel
Candlestick charts create patterns that could predict future price movements upon their completion. Intraday traders often use this to analyze market sentiment and future price movements.
Each candlestick represents a specific period. A candlestick pattern forms when one or more candlesticks align in a certain way, creating recognizable shapes or forms on the chart.
Traditionally, candlesticks are best used in daily trading. The concept is that each candle represents a trading day, encapsulating the day’s complete news, data, and price movement.
Hang on! Let us clear our basics first. Otherwise, you will think that we made a fake promise. It is indeed not as technical as it sounds. Let us deconstruct each one of the jargon.
What is a chart?
In stock market analysis, a chart is a graphical representation of the price movement for a particular security over a specific period. The X-axis represents time, and the Y-axis represents the stock price.
Now, let us see what a candlestick is:
We call each unit of a candlestick chart a candle, and a candle gives more realistic information on the price movement compared to lines. A candle represents the price movement of stock during a time frame, which constitutes an open price, a higher price, a lower price, and a close price.
Using a candlestick chart, we need four parameters to analyze the price movement within a specific time frame. These parameters are represented as the components of the candlestick (open, high, low, and close). Let us see the parameters and their respective part of the candlestick.
- The price of the stock at the beginning of that particular time frame. (Open)
- The highest price of stock within the time frame. (High)
- The lowest price of stock within the time frame. (Low)
- The price of the stock at the closing point (Close)
Candlestick Chart Components
A candle has the following parts:
- The central body: It is the real body that connects the opening and closing price and is rectangular.
- Upper Shadow: It connects the high point to the close or open.
- Lower shadow: It connects the low point to the closed/open.
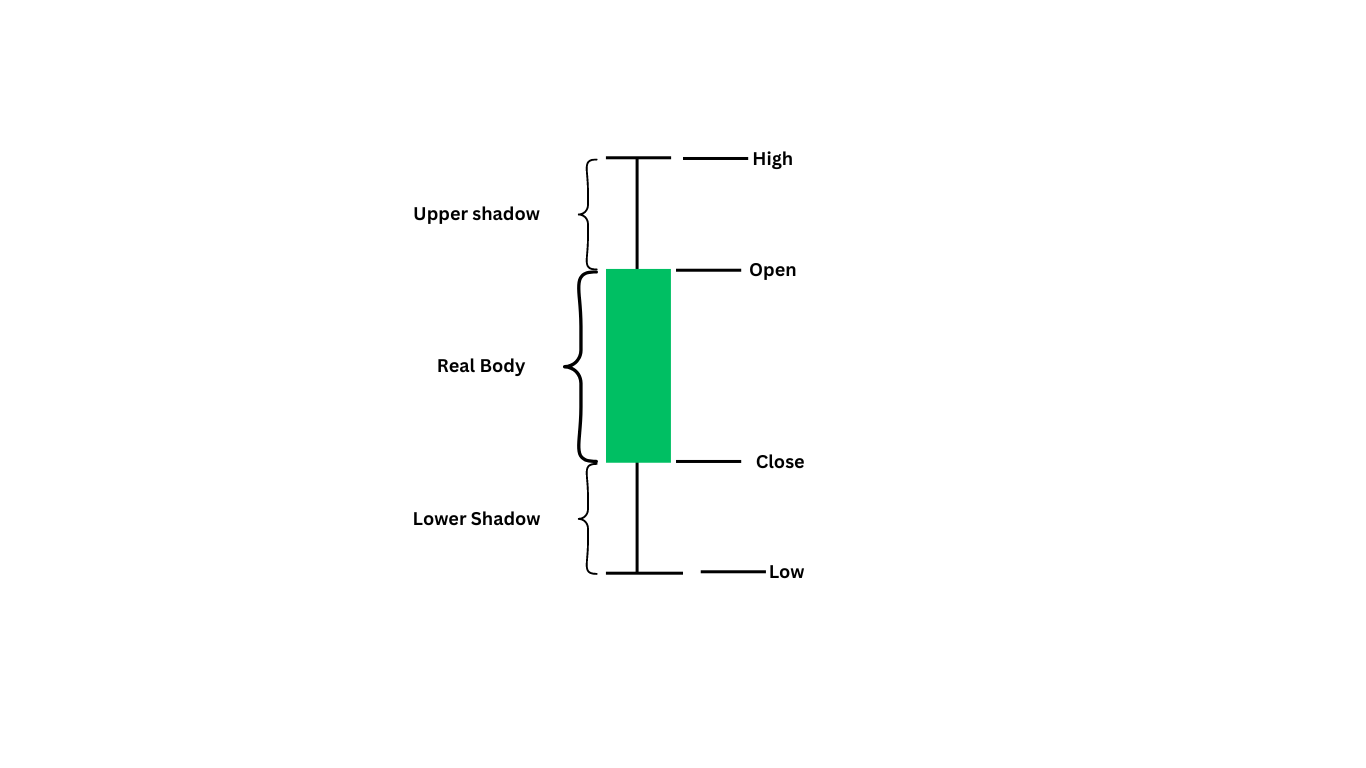
Let us understand the body of a candlestick with the help of an example;
Suppose we are considering the price movement of a stock for 10 minutes. The point “open” is where the price of the stock stands at the beginning of this 10-minute time frame. During the ten-minute window, the price reaches its highest point which is represented by the high, and the point where the price reaches the lowest is represented by the low. The point where the price reaches at the end of the ten minutes is called the close of the body.
Suggested Read: SEBI Registered Telegram Channels in India
Bullish and Bearish Candlestick Pattern
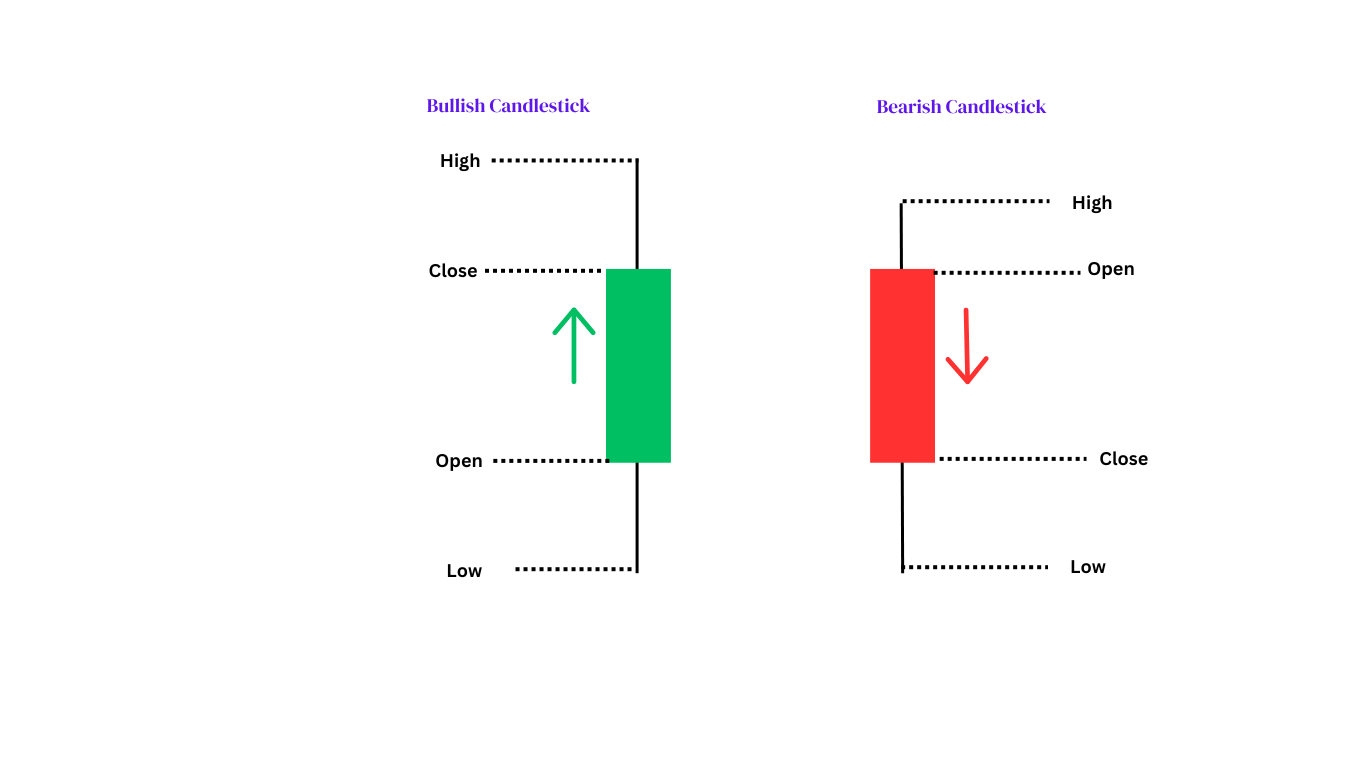
Based on the price movement, the candle can be either green or red. (We can use other colors as well, but green and red are commonly used). That is it can be either bullish or bearish. Here, the close will be higher than the open. The bullish candle shows more activity from buyers.
Commonly, for bullish, where the price of the stock increases, the color of the candle is green. In the picture, we can see the closed amount is above the opening amount of the candle, which indicates that the price increased during that 10-minute frame. Analyzing this trend in the light of supply and demand, we can understand that there are more sellers available in the market to buy this stock. As the demand increased, buyers raised the price and closed at a higher point than when it started.
Whereas, for bearish, where the price of the stock decreases, the color of the candle is red. You can see in the picture that the bearish candle opened at the top and closed at the bottom. In this case, we can understand that there are not enough buyers in the market. The sellers had to decrease the price as the demand decreased. So, the closing price, or the close of the candle, is below the opening price.
Here, we have talked about the parts of a single candlestick. When it is represented as a chart there will be several such candlesticks. In this case, we have taken the time frame of ten minutes. So after ten minutes, the next candle will form, and probably the “open,” of the next candle will be where the “close” of the previous candle is.
Types of Single Candlestick Patterns
Marubozu
Marubozu is a candlestick with little or no upper shadow or lower shadow. It only has a real body. Irrespective of the previous trends, Marubozu can appear anywhere in the chart.
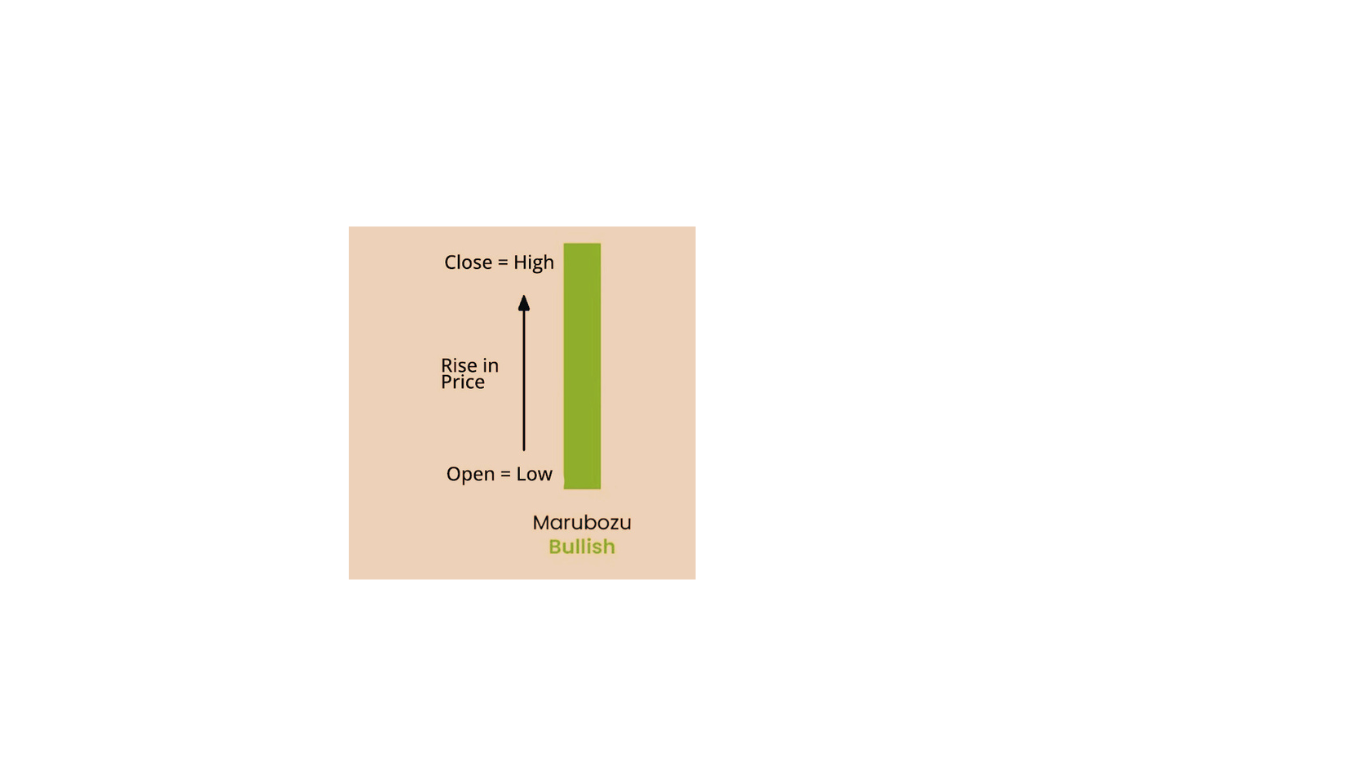
Bullish Marubozu
- A bullish Marubozu occurs when the opening price is the lowest price of the trading session, and the closing price is the highest.
- The candlestick has a long green or white body with little to no upper shadow, indicating strong buying pressure throughout the session.
- The absence of an upper wick suggests that buyers dominated the entire trading period, and the price closed near the high of the day.
- Bullish Marubozu is considered a strong bullish signal, indicating a potential continuation of an uptrend.
Analysis of Bullish Maruboze
As bullish Maruboze shows an upward trend, it is assumed that the price will continue to go up. Hence, this candlestick suggests placing an order at the closing end of this bullish candlestick and you can set the stop-loss at the opening of this bullish candlestick.
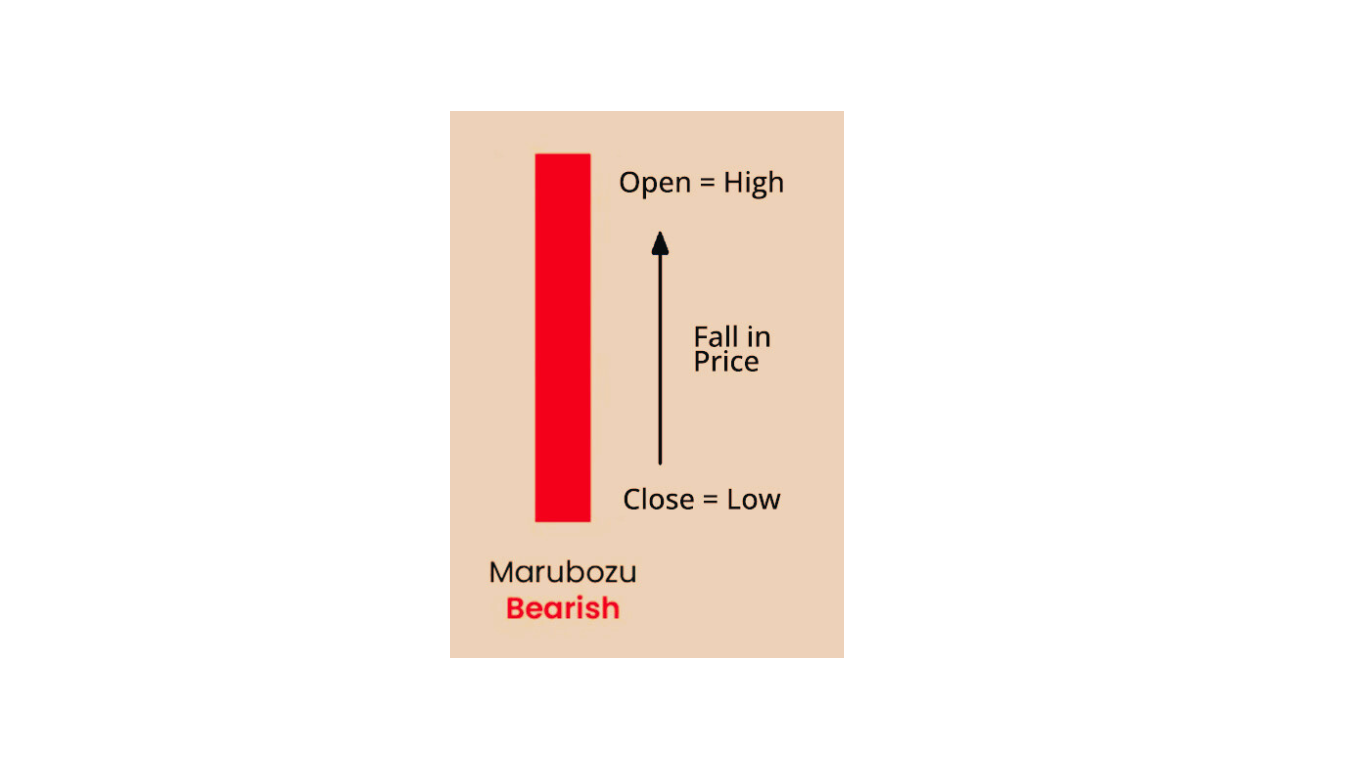
Bearish Marubozu
- A bearish Marubozu occurs when the opening price is the highest price of the trading session, and the closing price is the lowest.
- The candlestick has a long red or black body with little to no lower shadow, indicating strong selling pressure throughout the session.
- The absence of a lower wick suggests that sellers dominated the entire trading period, and the price closed near the day’s low.
- Bearish Marubozu is considered a strong bearish signal, indicating a potential downtrend continuation.
Analyzing the bearish Maruboz
In the case of bearish Maruboz, the price trend is downwards, so there is a high possibility of continuing the trend. Hence, you can place an order at the close of the bearish Maruboz and set the stop loss at the ‘open’ of this bearish Maruboz to limit your loss. Though candlestick analyses have a high probability of working, it may not be the case always.
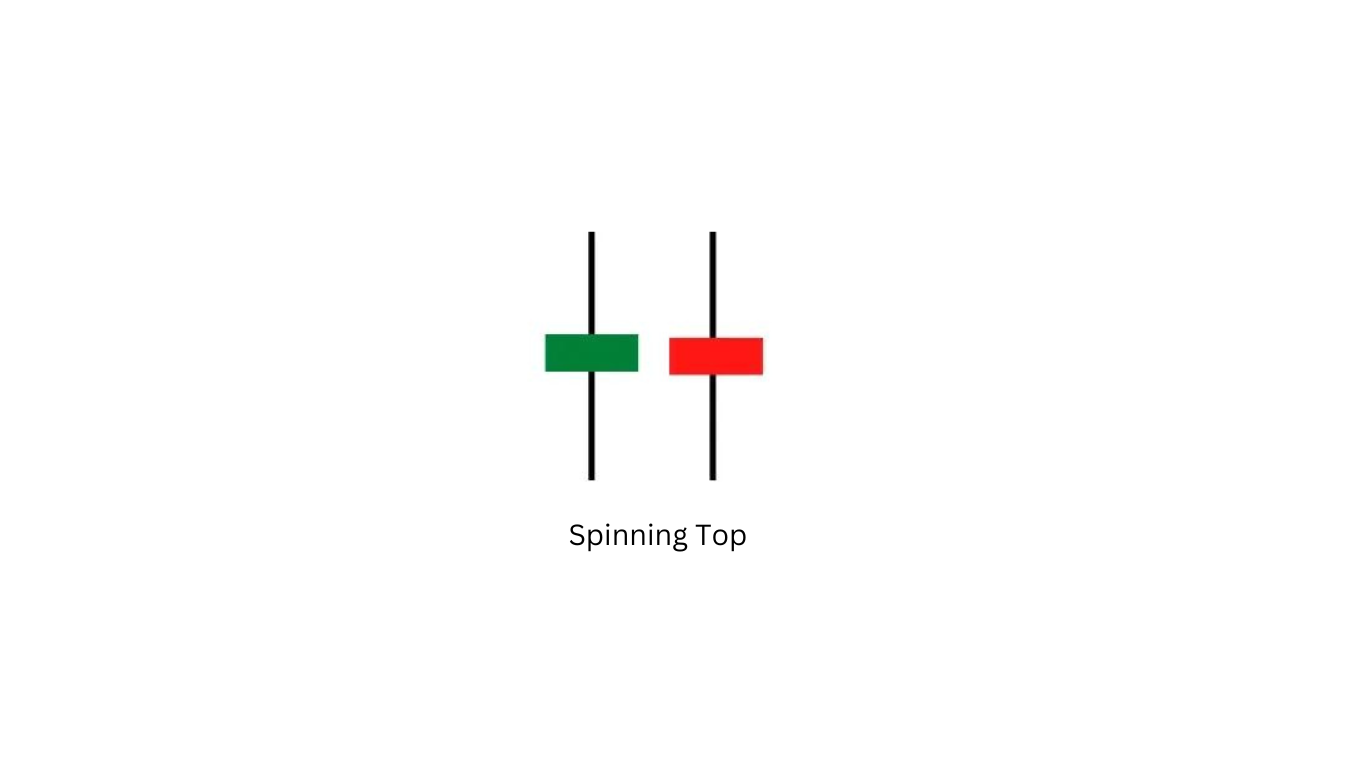
Spinning Top
A spinning top candlestick occurs when the opening and closing prices of the stock (or other financial instruments) are very close to each other. It creates a small body with relatively longer upper and lower shadows (Wicks or tails).
Indications
- The difference between opening and closing prices is minimal.
- Longer shadows indicate that there was a significant price movement during the time frame.
- This pattern suggests the market indecisiveness. Bulls and bears are in a tug of war. But neither of them was able to gain control.
- It is important to analyze the position of the candlestick within the overall trend to gain more insights into future trends. In an uptrend, a spinning top may signal potential weakness. While in a downtrend, it could indicate a potential reversal.
So, it is important to use other technical indicators along with the spinning top to make a more informed decision.
Doji
A doji candlestick pattern is characterized by a candle with a very small body, where the opening and closing are nearly the same or the same. The nonexistence of the body usually coexists with long upper and lower wicks. Though there are variations of doji candlesticks, all of them share a non-existent or smaller real body.
Doji signals the indecision between buyers and sellers. Their longer upper and lower wicks indicate the price movement from higher to higher and lower ends during the trading period. This struggle between bull and bear may occur during a period of consolidation, trend reversal, or trend continuation.
There are different types of doji candles, such as standard doji, long-legged doji, gravestone doji, and dragonfly doji. Each one of them has different variations in terms of the size and position of the body and wicks.

Analysing Doji
Now, let us analyze a doji candlestick.
- Consider the prevailing trend. A Doji in an uptrend or downtrend may have different implications. In an uptrend, a Doji could signal potential weakness, while in a downtrend, it may suggest a weakening bearish momentum.
- Don’t solely rely on a single Doji candle for trading decisions. Look for confirmation from other technical indicators, trendlines, or support/resistance levels.
- Analyze the volume accompanying the Doji. An increase in volume can add significance to the pattern, suggesting a stronger potential for a reversal or continuation.
- Pay attention to the candles that follow the Doji. A bullish or bearish candle after a Doji can provide additional confirmation of the market’s direction.
- Consider the timeframe in which the Doji appears. A Doji on a shorter timeframe might have different implications than on a longer timeframe.
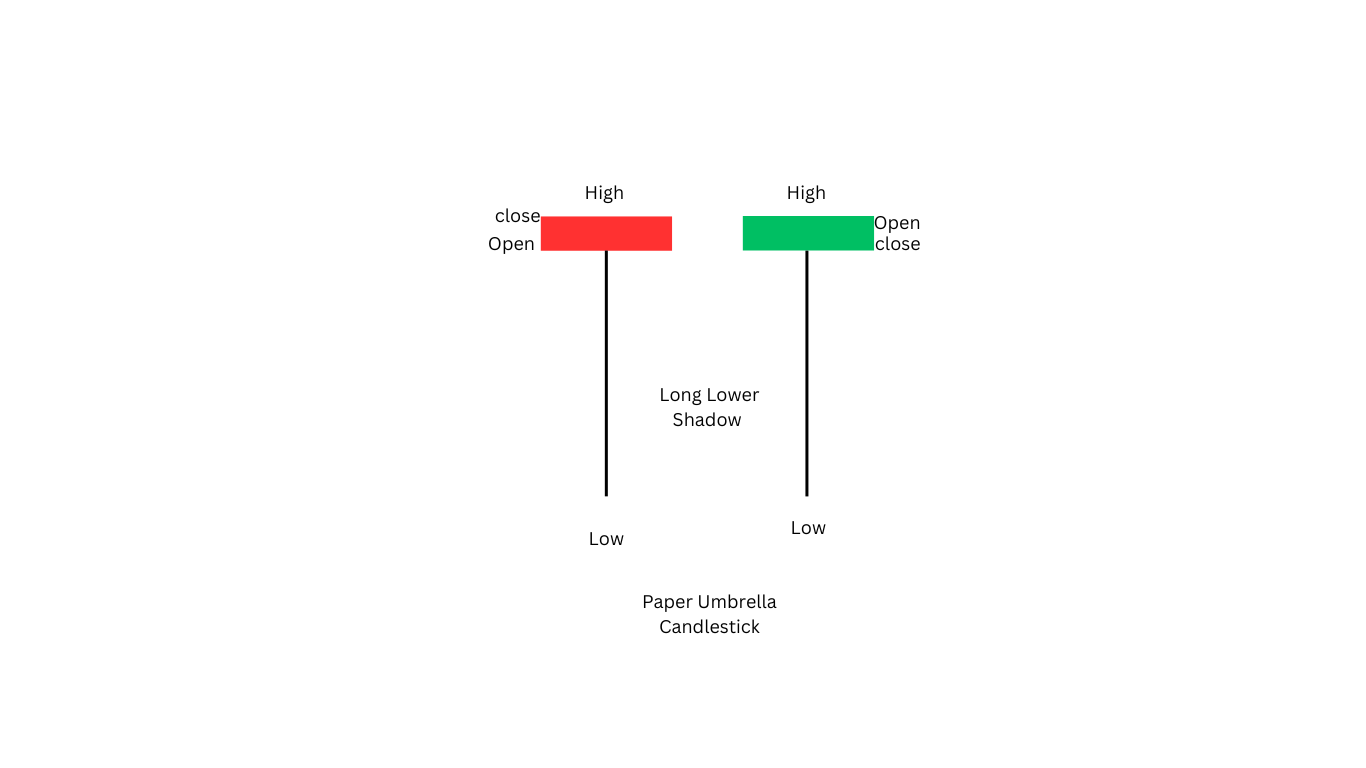
Paper Umbrella
The paper umbrella is a single candlestick pattern that helps traders in setting up directional trade. The interpretation of the paper umbrella changes based on where it appears on the chart. If a paper umbrella occurs at the end of a downtrend it is called a hammer and it is always a buy signal. If an umbrella appears at the top end of an upward trend it is called a hanging man. It indicates a trend reversal to bearish and it implies a sell signal.
Hanging Man
- Shape: It has a small real body (can be bullish or bearish) at the top of the candlestick with a long lower shadow and little to no upper shadow.
- Indication: Typically forms after an uptrend and suggests potential weakness. It implies that even though the price opened significantly higher, sellers pushed the price lower during the session.
Hammer
- Shape: It has a small real body (can be bullish or bearish) at the bottom of the candlestick with a long lower shadow and little to no upper shadow.
- Indication: Usually occurs after a downtrend and signals a potential reversal. It suggests that despite a significant dip in price during the session, buyers stepped in and pushed the price higher by the close.
Analyzing Paper Umbrella
- Confirmation: Look for confirmation from other technical indicators, trendlines, or support/resistance levels. A single candlestick pattern should not be the sole basis for a trading decision.
- Volume: Check the volume accompanying the pattern. An increase in volume can enhance the significance of the pattern.
- Trend Context: Consider the prevailing trend. A Hanging Man at the top of an uptrend or a Hammer at the bottom of a downtrend is more meaningful.
- Follow-up Action: Observe the candles that follow the Hanging Man or Hammer. A bullish or bearish confirmation candle can provide additional insight.
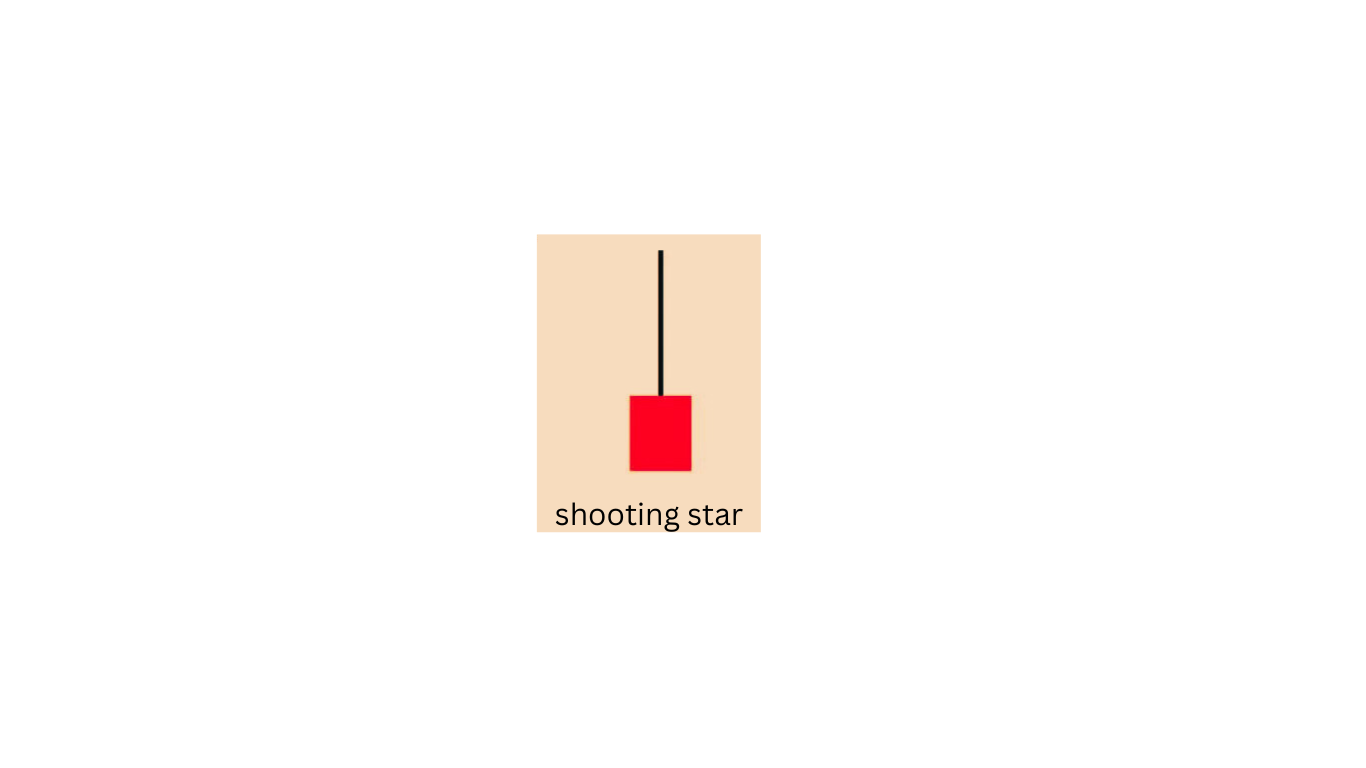
Shooting Star
A shooting star is a bearish candlestick pattern that typically occurs at the end of an uptrend. It signals potential weakness and a possible reversal of the current trend. Here are the characteristics of a shooting star candlestick and how to analyze it:
Characteristics of a Shooting Star
Shape: A shooting star has a small real body (can be bullish or bearish) at the bottom of the candlestick, with a long upper shadow and little to no lower shadow. The upper shadow should be at least twice the length of the real body.
Upper Shadow: The long upper shadow indicates that, despite a higher open, sellers took control during the session and pushed the price down. The longer the upper shadow, the more significant the signal.
Lower Shadow: A shooting star may or may not have a lower shadow. If present, it is usually short.
Analyzing Shooting Star
Trend Context: A shooting star is more meaningful when it occurs after a sustained uptrend. It suggests that buyers may be losing control, and the potential for a reversal increases.
Don’t rely solely on the shooting star for trading decisions. Look for confirmation from other technical indicators, such as support/resistance levels, trendlines, or other candlestick patterns.
Analyze the volume accompanying the shooting star. An increase in volume can strengthen the signal, indicating a stronger potential for a trend reversal.
Pay attention to the candles that follow the shooting star. A bearish confirmation candle or a pattern of lower highs and lower lows in subsequent sessions adds weight to the reversal signal.
Consider implementing risk management strategies, such as setting stop-loss orders, to protect your trades in case the reversal doesn’t materialize.
Now you know what a candlestick pattern is and how to identify and analyze single candlestick patterns. However, it is important to note that while candlestick patterns can provide valuable insights, they are most effective when used in conjunction with other technical analysis tools and indicators.
Disclaimer: This blog is solely for educational purposes. The securities/investments quoted here are not recommendatory.


