

In this article, we will take a look at what a sideways market is and explore the strategy and indicators of a sideways market. But before delving into the topic, let us understand the basics first.
The financial markets are dynamic ecosystems characterized by ever-fluctuating trends. While upward and downward trends are comparatively predictable, another phenomenon traders often encounter is the Sideways trend. In short, a sideways market or drift is a market where the price range of assets maintains a relatively narrow range over a period.
Understanding the nature of the sideways market and formulating an appropriate strategy is essential to navigating successful trading and reducing risk. In this comprehensive guide, we will explore various aspects of the sideways market, analyzing their characteristics, causes, and strategies for navigating them successfully.
What is the Sideways Market?
What is a sideways market? The defining characteristic of a sideways market is range-bound price movement, where the price range of an asset in the financial market fluctuates within a defined upper and lower boundary. The boundary is established by support and resistance representing price levels buying and selling pressure converge.
Too hard to digest? Worry not, let’s simplify this:
A sideways market is like a game where the price of something doesn’t go too high or too low, staying between two lines. These lines are like the floor and ceiling that the price bounces between. The floor is where people start buying more because it seems cheap, and the ceiling is where people start selling because it seems expensive.
Now, let us discuss the terms support and resistance in detail:
What is Support and Resistance in a Sideways Market?
Support is like a floor underneath the price of an asset where the price falls during its downward movement of the price within a sideways market. It is the point where the price touches before bouncing back upward. It appears like there is a strong force preventing the movement of price beyond this level. Investors see this as a buying opportunity as they believe the price won’t drop much below that level.
Let’s go back to the ceiling. Think of a ceiling above your head. When you jump, you can’t go higher than the ceiling, right? In a sideways trend, resistance acts as a ceiling above which the price of the asset cannot move. So, resistance is the point where the upward-moving price hits the ceiling and falls back down. Traders perceive this as a selling opportunity because they believe the price won’t move up above the resistance level.
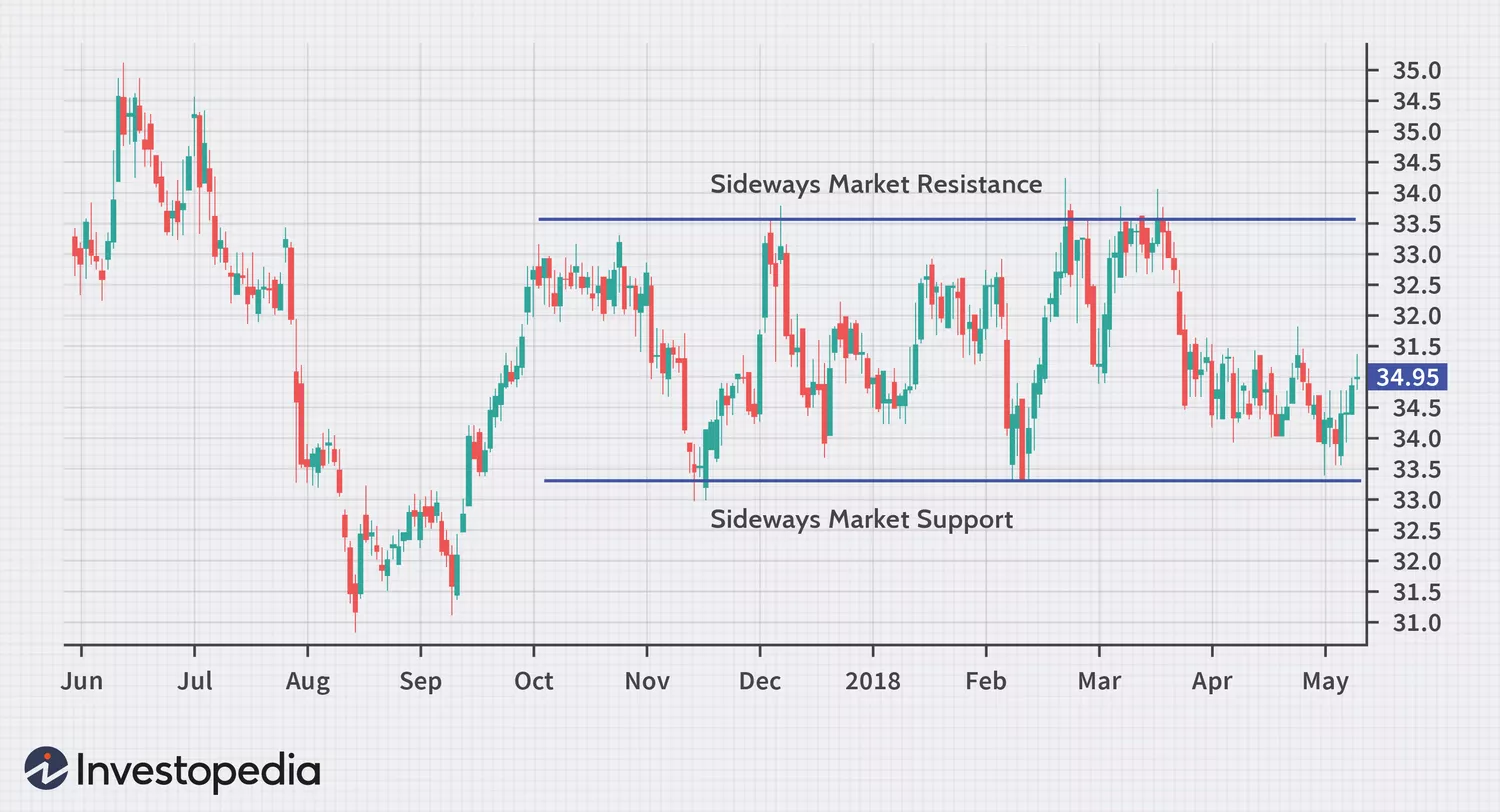
Image Source: Investopedia
Characteristics of a Sideways Market
Now that you know what a sideways market is and what its boundaries are let us see some of the main characteristics of a sideways market.
Lack of Trend Direction
Unlike the bullish or bearish market, where price moves relatively in a single direction, sideways markets lack a clear trend direction. Instead, the price moves within the established range, making it difficult for traders to identify a profitable direction following the trend.
Also Read: Bullish and Bearish – All You Need to Know
Uneven Price Action
Frequent fluctuations and reversals within the range of a sideways trend make it uneven and unpredictable. This volatility lacks the momentum seen in the trending markets and makes trading more challenging.
Reduced Momentum
The lack of a trend in a sideways market makes it difficult to trade by analyzing the momentum indicator. Traders should rely upon other technical indicators for prediction.
Increased Volatility
As the price fluctuates within a range, a sideways market may face increased volatility, which can present both opportunities and risks for traders.
Causes of Sideways Market
Several causes can contribute to the development of a sideways market. Let us understand some of the major causes of a sideways market in detail.
Get Free Trading Calls from SEBI Registered Experts
Market Indecision
A sideways trend mostly occurs when there is indecision among the market participants. The number of buyers and sellers in a market may become even, making it difficult to predict the price action.
Market indecision can also occur immediately after a significant uptrend or downtrend. The period of consolidation between such a trend may lead to a sideways trend.
An economic or geopolitical event may make the future direction of the market unpredictable. This indecisiveness among market participants may also lead to a sideways market.
Balanced Supply and Demand
In a balanced market, buyers and sellers are matched because of an asset’s balanced supply and demand. This situation leads to price stability within a range and sideways market.
Market Manipulation
In some cases, market manipulation or intervention by large institutional investors or governments can lead to a sideways market. These entities may engage in trading strategies aimed at keeping prices within a certain range for their benefit.
Lack of Significant News or Developments
Market-moving news and events act as catalysts for price action in a financial market. In the absence of such events, investors may wait for significant developments for the movement of price action. Here the market will remain under a range and lead to a sideways market, waiting for a catalyst to move the market forward.
Strategies for Navigating a Sideways Market
Navigating a sideways market requires an approach different from the trending market. Traders can use various strategies to make use of the price movement of assets within a definite range. Let us discuss some of the strategies for navigating a sideways market below.
Range Trading
Range trading is a popular strategy used in a sideways market, where traders buy and sell assets within the established range. Traders buy at the support level and sell at the resistance level using this strategy. By identifying the support level and resistance level within the range, traders can make maximum profit during a sideways trend in the market.
Breakout Trading
Breakout trading is placed with the anticipation of price movement outside the range-bound movement. Traders identify the support and resistance levels and place orders expecting the breakout from the range boundary either upward or downward. Traders using a breakout strategy in a sideways market expect a potential trend reversal or continuation.
Use Technical Indicators to Navigate a Sideways Trend
Traders can identify potential entry and exit points of a sideways market using technical indicators like moving averages, Bollinger bands, and oscillators. For example, Traders might use tools like the Relative Strength Index (RSI) or the Stochastic Oscillator to figure out when prices are too high or too low within the sideways range. This helps them decide when to buy or sell.
Get Free Trading Calls from SEBI Registered Experts
Implement Volatility-Based Strategy
In sideways markets where prices keep changing, strategies based on volatility can work well. Traders can use things like options to make bets on whether prices will swing a lot without needing to predict which way they’ll swing.
Adopt Risk Management Techniques
Effective risk management is crucial in a sideways market, as the uneven price movement may lead to unexpected losses. In order to protect the capital and manage risk, traders should use stop-loss orders and position-sizing techniques.
The sideways market poses a unique challenge to traders, which requires a nuanced analysis and approach to navigate successfully. Identifying the trend and implementing the proper strategy will help traders easily avoid risks and earn profits during a sideways trend. So don’t wait for a trend! Make use of the sideways trend to reap maximum returns.
FAQs About the Sideways Market
What is a sideways trend in trading?
The sideways trend is a financial market trend where prices move within a defined range without establishing a clear trend in either direction.
How do you identify a sideways market trend?
- Look for periods when the price moves sideways with no clear trend in both directions.
- Notice if the price tends to bounce between specific levels over time.
- Use momentum indicators like the Moving Average Convergence Divergence (MACD) or the Relative Strength Index (RSI) to detect reduced momentum.
- Pay attention to trading volume. In a sideways market, trading volume tends to decrease as buyers and sellers are evenly matched.
Which Indicator shows a sideways market in trading?
The Average True Range is one of the indicators to identify a sideways trend. The ATR measures the average price range of a security over a specific period, accounting for gaps and limit moves. In a sideways market, the ATR tends to be relatively low, reflecting the lack of significant price movements.
What happens after a sideways trend?
After a sideways trend the market either transitions into an uptrend or downtrend.
What are the other names of sideways trends?
The sideways trend is also known as the range bound or horizontal trend.


